Inflation at 6.8% in Canada | What impact for the Canadian dollar?
Inflation in Canada remains excessively high – What does this mean for the Canadian dollar?
The Canadian CPI print proved what the markets already thought, which is that inflation will keep going up and force the Bank of Canada to raise rates even more.
Toni Gravelle of the Bank of Canada said last week that the bank might have to raise rates above breakeven because the economy might become less sensitive to rate increases. Canada released the CPI for April on Wednesday, and the numbers back up Gravelle’s idea that rates should go up. The stock went up 6.8% YoY, which was better than what was expected (6.7%) and what it went up by in March (6.7%). Since January 1991, this is the biggest increase. Also, the core CPI was even more than what was expected. The reading was 5.7 percent y/y, which was higher than what was expected (5.4 percent y/y), and it was 5.5 percent y/y in March. This is the most the base number has ever been! As a reminder, on April 13, the Bank of Canada raised rates by 50 basis points, bringing them to 1%. It also said that more rate increases will be needed if demand picks up and inflation stays well above the BOC’s target of 2%. The next meeting of the Bank of Canada is on June 1.
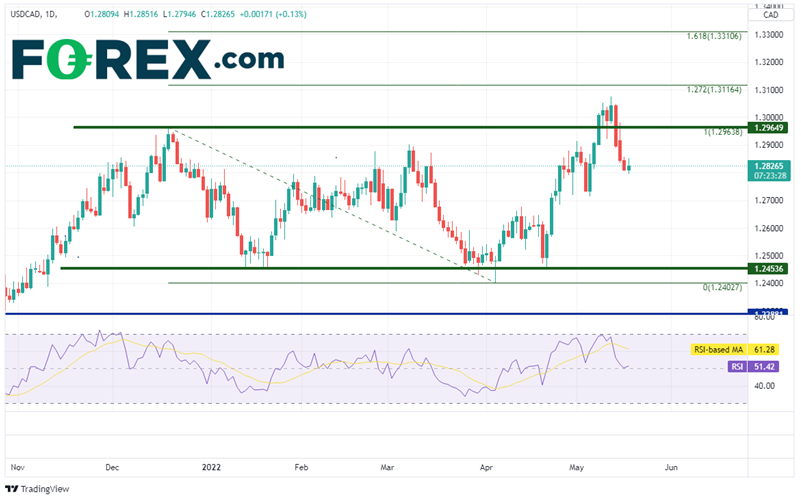
Since mid-November 2021, the USD/CAD pair had been trading in a range between 1.2453 and 1.2965 on a daily chart. On May 5, the pair broke above the upper trendline of the channel. On May 12, it reached a high of 1.3077, just below the 127.2 percent Fibonacci extension from the highs of December 20, 2021 to the low of April 5, near 1.3116. So far, though, the move has been a false breakout because the price fell for the next three days in a row and moved back into the range.
USD/CAD daily chart
Since April 21, the price of the USD/CAD pair has been moving up in its own channel on the 4-hour chart. But on May 16, the pair broke below the channel and went back to near 1.2840, which is the 38.2% Fibonacci retracement from the lows on April 21 to the highs on May 12. If the price keeps going down, the first support is at the 50 percent retracement from the same time frame, which is near 1.2767. The second support is at 1.2725, which is where the price hit bottom twice. If the price breaks below, it could fall to the 61.8 percent Fibonacci retracement from the recently mentioned time frame near 1.2695. But if the current move is just a pullback in the uptrend, the first point of resistance is the lower trendline of the upsloping channel near 1.2950, and then the recent highs at 1.3077.
USD/CAD 4 hour chart
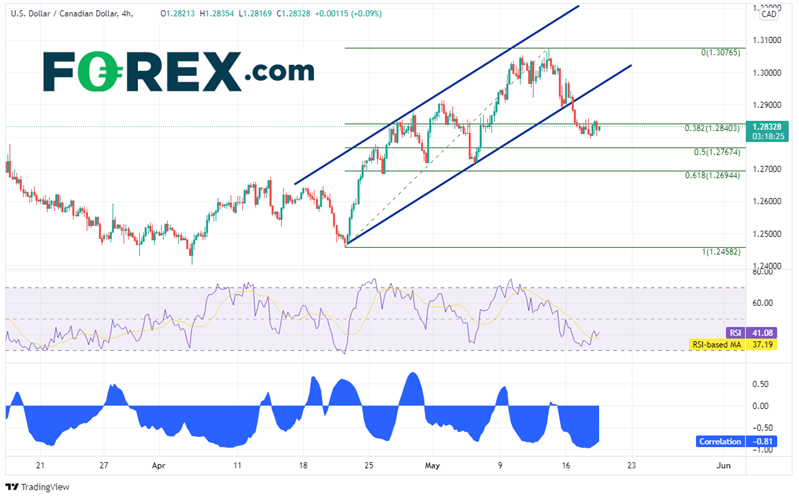
In the lower part of the 4-hour chart, you can see that the USD/CAD pair and Crude Oil have a strong negative correlation with a reading of -0.81. Any number below -0.80 is thought to be strong. So, when Crude Oil moves in one direction, the USD/CAD pair should move in the opposite direction on a shorter time frame. Please note that this is only for the 4-hour chart. On the daily chart, the correlation is close to 0, which means that there is no relationship between the two things. If the strong negative relationship keeps going on the shorter time frame, it may move to the longer day time frame.
The Canadian CPI confirmed what the markets already thought, which is that inflation will keep going up in Canada, forcing the Bank of Canada to raise rates even more. But it’s important to keep an eye on how the USD/CAD pair has been moving lately. Is this just a pause in an upward trend, or will it get worse? On a 4-hour chart, the direction of Crude Oil can give hints.