Bulls keep control in the silver market (XAG/USD)
The bulls keep control in the silver market
On Monday morning, more people bought silver. This added to its recent rise near the 200-day moving average SMA. This was the seventh day in a row that prices went up, and it pushed spot prices to a six-week high in the first half of the European session, between $25.90 and $25.95 USD.
On Monday, silver prices started going up again and hit a new high for the last few weeks.
If the price goes above the 61.8 percent Fibonacci retracement level, it looks like the price will keep going up.
To change the bullish outlook for silver prices, they would have to stay below $25.00 USD for a while.
From a technical point of view, the price of silver (XAG/USD) seems to have settled above the 61.8 percent Fibonacci retracement level of the drop from $26.95 to $23.97 USD.
Also, the technical indicators on the daily chart are moving in the right direction and are not yet in the “overbought” zone, which helps the bulls.
Before confirming a bullish breakout and positioning themselves for more short-term gains, traders are likely to wait for more buying above $26.00. The silver price may try to test an area of intermediate resistance near $26.40 on its way to a high near $27.00 in 2022.
Silver Price Chart (XAG/USD) 4 Hours
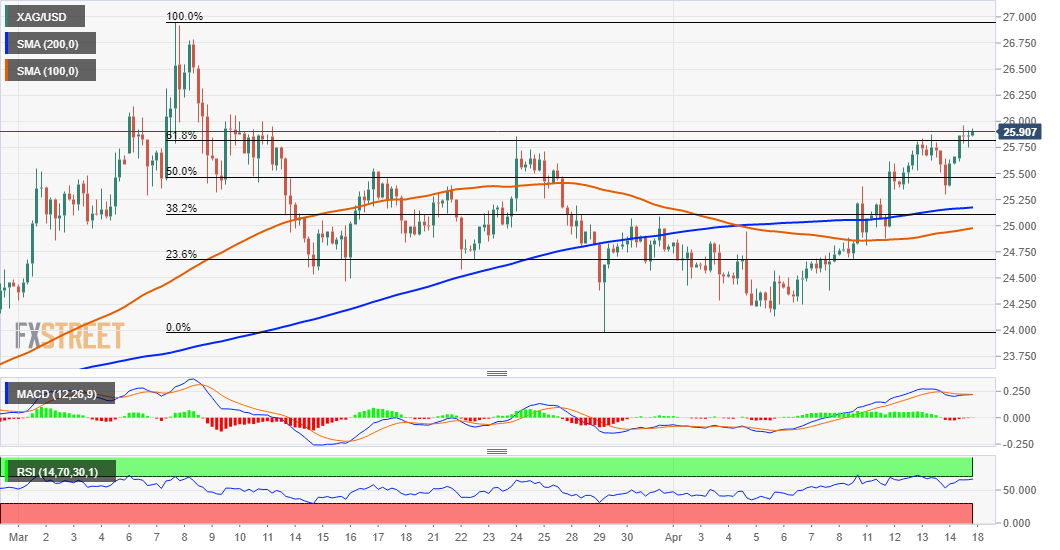
On the other hand, if silver prices go down, they might find good support near the 50% Fibonacci retracement level, which is between $25.50 and $25.45 USD. This is followed by the low of the last session, which is around $25.25, and then the 38.2% Fibonacci retracement level, which is around the psychological $25.00 mark and should act as a pivot point.
A convincing break below would lead to technical selling and bring the price of silver (XAG/USD) back to the 23.6 percent Fibonacci retracement level, which is around $24.65 USD.
The next area of support is around $24.30. If the price falls below that, it could go down to the 200-day moving average SMA, which is around $24.00.
By FXStreet’s Haresh Menghani
Haresh Menghani, a Financial Markets Analyst and New Editor, has joined the FXStreet team. He has been analyzing global financial markets for 8 years and has a lot of experience in this field. Haresh has a master’s degree in business administration and financial analysis. The Institute of Chartered Financial Analysts India also gave him the Chartered Financial Analyst (CFA) title (ICFAI).